Process variables
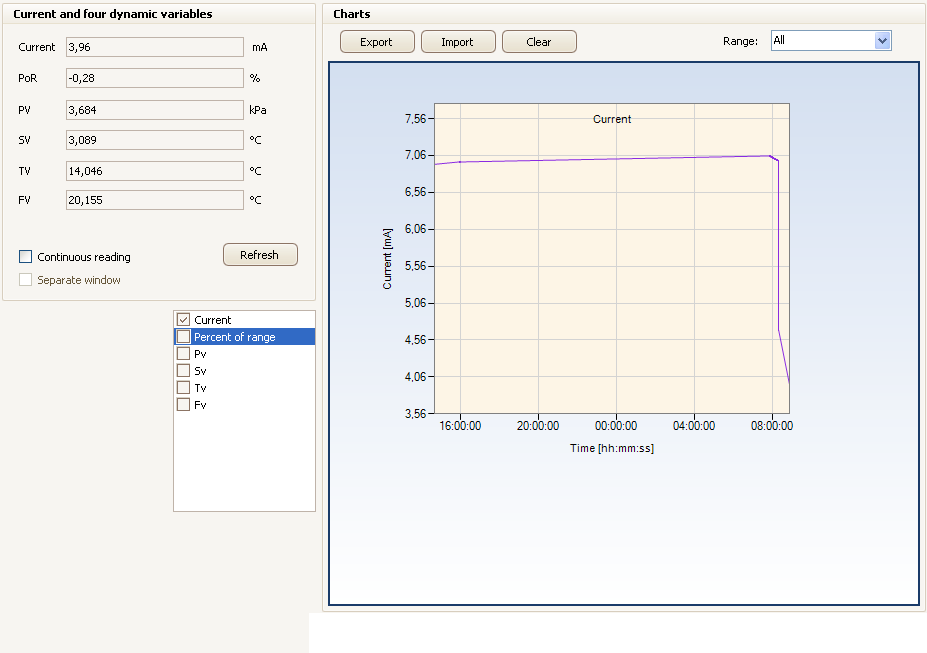
It allows to view electric current and transmitter process variables in the form figures and charts.

The area Current and four process variables contains:
- Current values
- button Refresh
- it downloads current values from a transmitter.
- button Continuous reading
- continuous reading mode for process values.
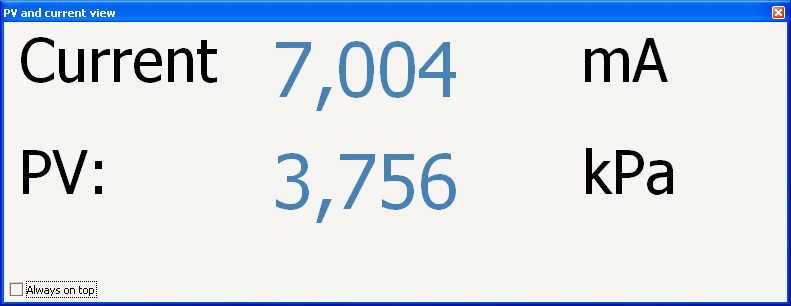
- button External window
- it displays values in a separate window, while in continuous reading mode (see picture below).
The area Charts contains:
- Charts for process variables and electric current – the charts are visible after selecting visibility of separate charts on a legend placed on the left side of a chart.
- Chart area has a cursor and a zoom function.
- To see a cursor, put the mouse over a data point in a chart line.
- To activate zoom, left-click on a chart area, and keeping the button pressed, drag the mouse in any direction.
- button Export
- saves charts to a text file (csv).
- button Import
- imports previously saved charts from a text file (csv).
- button Clear
- deletes chart data.
- button Time base
- it allows to change, in continuous reading mode, the time interval of viewed charts.

Selecting the option Always on top will cause that the window will always be displayed over other system windows.


